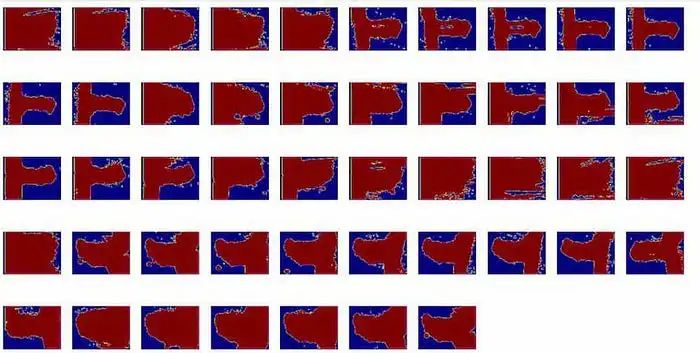
可视化每个图像的深度图:
# Initialize an accumulator for the sum of depth maps
sum_depth_map = np.zeros_like(depth_maps[0], dtype=np.float64)
# Compute the sum of all depth maps
for depth_map in depth_maps:
sum_depth_map += depth_map.astype(np.float64)
# Calculate the mean depth map by dividing the sum by the number of depth maps
mean_depth_map = (sum_depth_map / len(depth_maps)).astype(np.uint8)
# Display the mean depth map
plt.figure(figsize=(8, 6))
plt.imshow(mean_depth_map, cmap='jet')
plt.title('Mean Depth Map')
plt.axis('off')
plt.show()
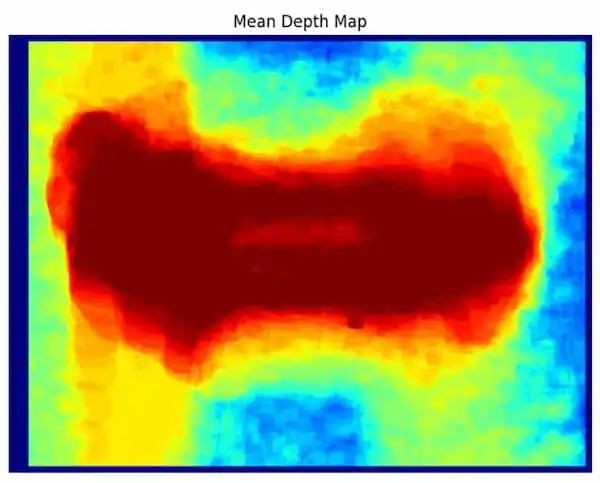
输出:

解释:这段代码通过累加深度图来计算平均深度图。然后,通过将总和除以深度图的数量来计算平均值。最后,使用jet颜色图谱显示平均深度图以进行可视化。
从平均深度图计算三维点云
# Initialize an accumulator for the sum of depth maps
sum_depth_map = np.zeros_like(depth_maps[0], dtype=np.float64)
# Compute the sum of all depth maps
for depth_map in depth_maps:
sum_depth_map += depth_map.astype(np.float64)
# Calculate the mean depth map by dividing the sum by the number of depth maps
mean_depth_map = (sum_depth_map / len(depth_maps)).astype(np.uint8)
# Display the mean depth map
plt.figure(figsize=(8, 6))
plt.imshow(mean_depth_map, cmap='jet')
plt.title('Mean Depth Map')
plt.axis('off')
plt.show()

解释:这段代码通过对深度图进行累加来计算平均深度图。然后,通过将总和除以深度图的数量来计算平均值。最后,使用Jet颜色映射来可视化显示平均深度图。
计算平均深度图的三维点云
#converting into point cloud
points_3D = cv2.reprojectImageTo3D(mean_depth_map.astype(np.float32), np.eye(4))
解释:该代码将包含点云中点的三维坐标,并且您可以使用这些坐标进行三维重建。
从点云生成网格
安装库
!pip install numpy scipy
导入库
#importing libraries
from scipy.spatial import Delaunay
from skimage import measure
from skimage.measure import marching_cubes
生成网格
verts, faces, normals, values = measure.marching_cubes(points_3D)
解释:该代码将Marching Cubes算法应用于3D点云以生成网格。它返回定义结果3D网格的顶点、面、顶点法线和标量值。
可视化网格
fig = plt.figure()
ax = fig.add_subplot(111, projection='3d')
ax.plot_trisurf(verts[:, 0], verts[:, 1], verts[:, 2], triangles=faces)
plt.show()
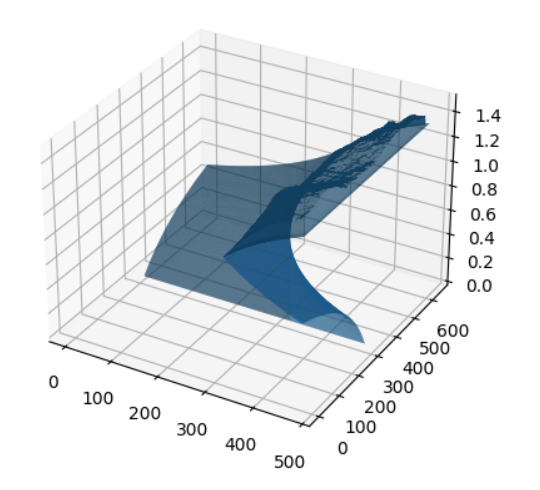
输出:

解释:该代码使用matplotlib可视化网格。它创建一个3D图并使用ax.plot_trisurf方法将网格添加到其中。
这段代码从Temple Ring数据集加载图像,并使用块匹配(block matching)进行每个图像的深度图计算,然后通过平均所有深度图来计算平均深度图,并使用它来计算每个像素的三维点云。最后,它使用Marching Cubes算法从点云生成网格并进行可视化。
